Conversion Graph
Graph for displaying a conversion path
Get it
If you are going to use this library I recommend using the version on Central repository. You can add it to your project by adding this line to your dependecies inside your build.gradle:
compile 'com.ncona:conversion-graph:1.0.0@aar'
If you prefer you can always download this repository and generate your own aar by running gradle build.
Use it
Start by importing the library:
import com.ncona.conversiongraph.Graph;
You need to pass the context to the constructor:
Graph conversiongraph = new Graph(this);
Then you will need to create a list of Measures. A Measure consists of a label and an array of values. Here is an example of how to create this list of Measures:
import com.ncona.conversiongraph.models.Measure;

// Some more code

// Create the list and populate it
List<Measure> measures = new ArrayList<Measure>();
int[] values = { 10000, 5000 };
measures.add(new Measure("Leads", values));
int[] values2 = { 3000, 2800 };
measures.add(new Measure("Prospects", values2));
int[] values3 = { 500, 100 };
measures.add(new Measure("Customers", values3));

// Add the measures to the graph
conversiongraph.setMeasures(measures)

// Some more code
For each of the values you will need to provide a legend. In the previous example we have two values per measure so we would need two legends:
import com.ncona.conversiongraph.models.Legend;

// Some more code

Legend[] legend = {
    new Legend("this month", Color.YELLOW),
    new Legend("Last month", Color.RED),
};
conversiongraph.setLegends(legend);

// Some more code
Now your view is ready to be inserted anywhere you want:
setContentView((View)conversiongraph);
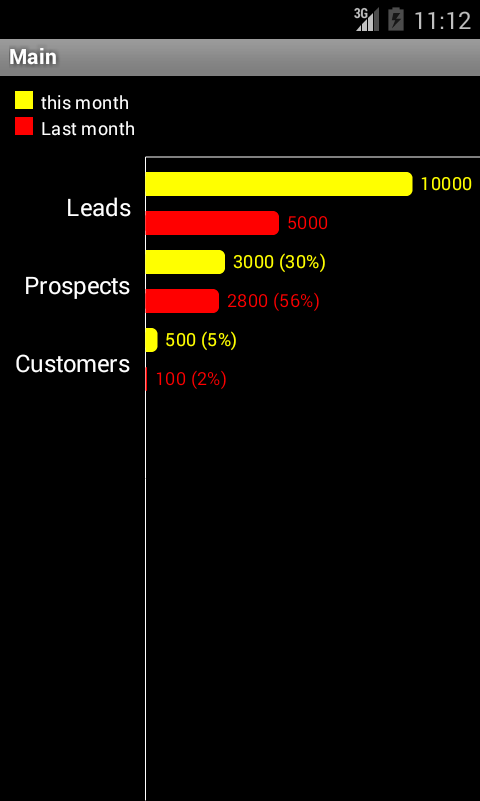
The previous example will give you this result: