Charts


- Author: Stef Schulz
- Repository: https://github.com/slothsoft/charts
- Open Issues: https://github.com/slothsoft/charts/issues
- Wiki: https://github.com/slothsoft/charts/wiki
- Developer Resources: JavaDoc, Executed Tests, Code Coverage
A framework for creating charts. For my musings before even starting to code see the Preliminary Considerations.
Content:
Getting Started
Prerequisites
You need at least Java 1.8 or above to use this library. You can use Maven as a build tool, but Gradle or using plain JARs should work as well.
The .travis.yml shows which JDK this library is build and tested against.
Installing
This library is in Maven Central, so you can easily add it like this:
<dependency>
	<groupId>de.slothsoft.charts</groupId>
	<artifactId>charts</artifactId>
	<version>0.2.1</version>
</dependency>

<dependency>
	<groupId>de.slothsoft.charts</groupId>
	<artifactId>swt-charts</artifactId>
	<version>0.2.1</version>
</dependency>

<dependency>
	<groupId>de.slothsoft.charts</groupId>
	<artifactId>swing-charts</artifactId>
	<version>0.2.1</version>
</dependency>
For other build tools and the JAR take a look at Maven Central or the MVN Repository.
Using the Framework
Examples for how to use this framework are located here.
You usually start by creating the chart you wish to display.3
BarChart:
BarChart chart = new BarChart();
chart.addBars(13, 5, 10, 15);
LineChart:
LineChart chart = new LineChart();
chart.addLine(new DataPointLine(-4, -2, -1, -0.5, 0));
chart.addLine(new FunctionLine(x -> Math.cos(x)).color(0xFF00FFFF));
PieChart:
PieChart chart = new PieChart();
chart.addSlices(1, 3, 5, 15);
And then you need to set these charts as the model for your GUI framework.
SWT:
ChartControl chartControl = new ChartControl(shell, SWT.BORDER);
chartControl.setModel(chart);
Swing:
ChartControl chartControl = new ChartControl(chart);
There are more extensive examples here, for instance:
- Chart types
- GUI Frameworks
- Miscellaneous
- SVG (using Apache Batik)
Versions
| Version | Changes |
|---|---|
| Future | |
| 0.2.1 | Hotfix |
| 0.2.0 | Swing GUI & bar chart |
| 0.1.0 | first draft of the API |
Features
If something is missing, request it via a new issue.
To see examples of the charts in action, check the wiki page. This page contains an image for each chart and GUI framework.
For the features of the GUI controls see this wiki page.
Chart
- JavaDoc: Chart
All charts have these features:
- hook
RefreshListeners that get notified over changes - configure
Border(JavaDoc)- change general display information (spaces on all four sides)
- configure
Title(JavaDoc)- change general display information (displayed text, color, font, size, position, text alignment)
- change general display information (background color)
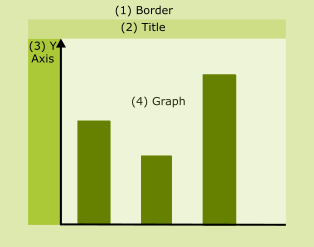
BarChart
- JavaDoc: BarChart
Bar charts have these features:
- all the features of
Chart - manage the bars of the chart (add, remove)
- change general display information (value, color)
- change general display information (default bar color)
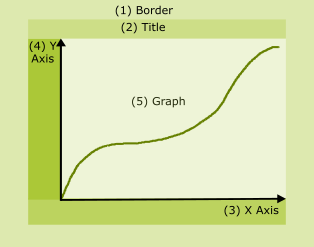
LineChart
- JavaDoc: LineChart
Line charts have these features:
- all the features of
Chart - manage lines (add, remove)
- line implementation for functions and for concrete data points
- change general display information (color)
- configure
XAxis(JavaDoc) andYAxis(JavaDoc)- change general display information (tick size and step length, arrow size, position)
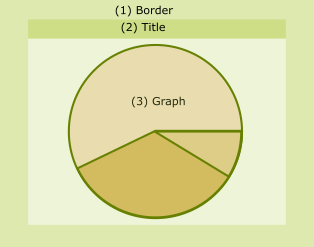
PieChart
- JavaDoc: PieChart
Pie charts have these features:
- all the features of
Chart - manage the slices of the chart (add, remove)
- change general display information (percentage value, color)
- change general display information (start angle, pie color, pie border)
License
This project is licensed under the MIT License - see the MIT license for details.